Background
Duration
Location
Course
Group
JAN 2022
Eindhoven, the Netherlands
Data-enabled Design
Course team of 4
Introdution
This project is derived from the requirement of the topic "Data Enabled Design". We needed to advance the design through objective data collection and analysis.
Unlike previous patient-only designs, we decided to start with the patient's co-habitants this time. We observed and analyzed data from a week in the lives of diabetic patients and their partners, and designed an interactive lighting device to facilitate communication and raise awareness about healthy eating.
Data Collection
Data collection was divided into two phases, an objective data collection phase and a subjective data collection phase. The objective data was collected using both the control panel unit and the PCR infrared sensor on the bathroom door. Data were collected in the following manner.
Touchable panel: Users were asked to press a button on the manipulation panel once each time they consumed a high sugar content food.
PCR infrared sensor: used to track the patient's toileting pattern to determine the user's water intake and health status.
Mobile Pedometer: We also track the patient's daily exercise through the pedometer function in the patient's cell phone.
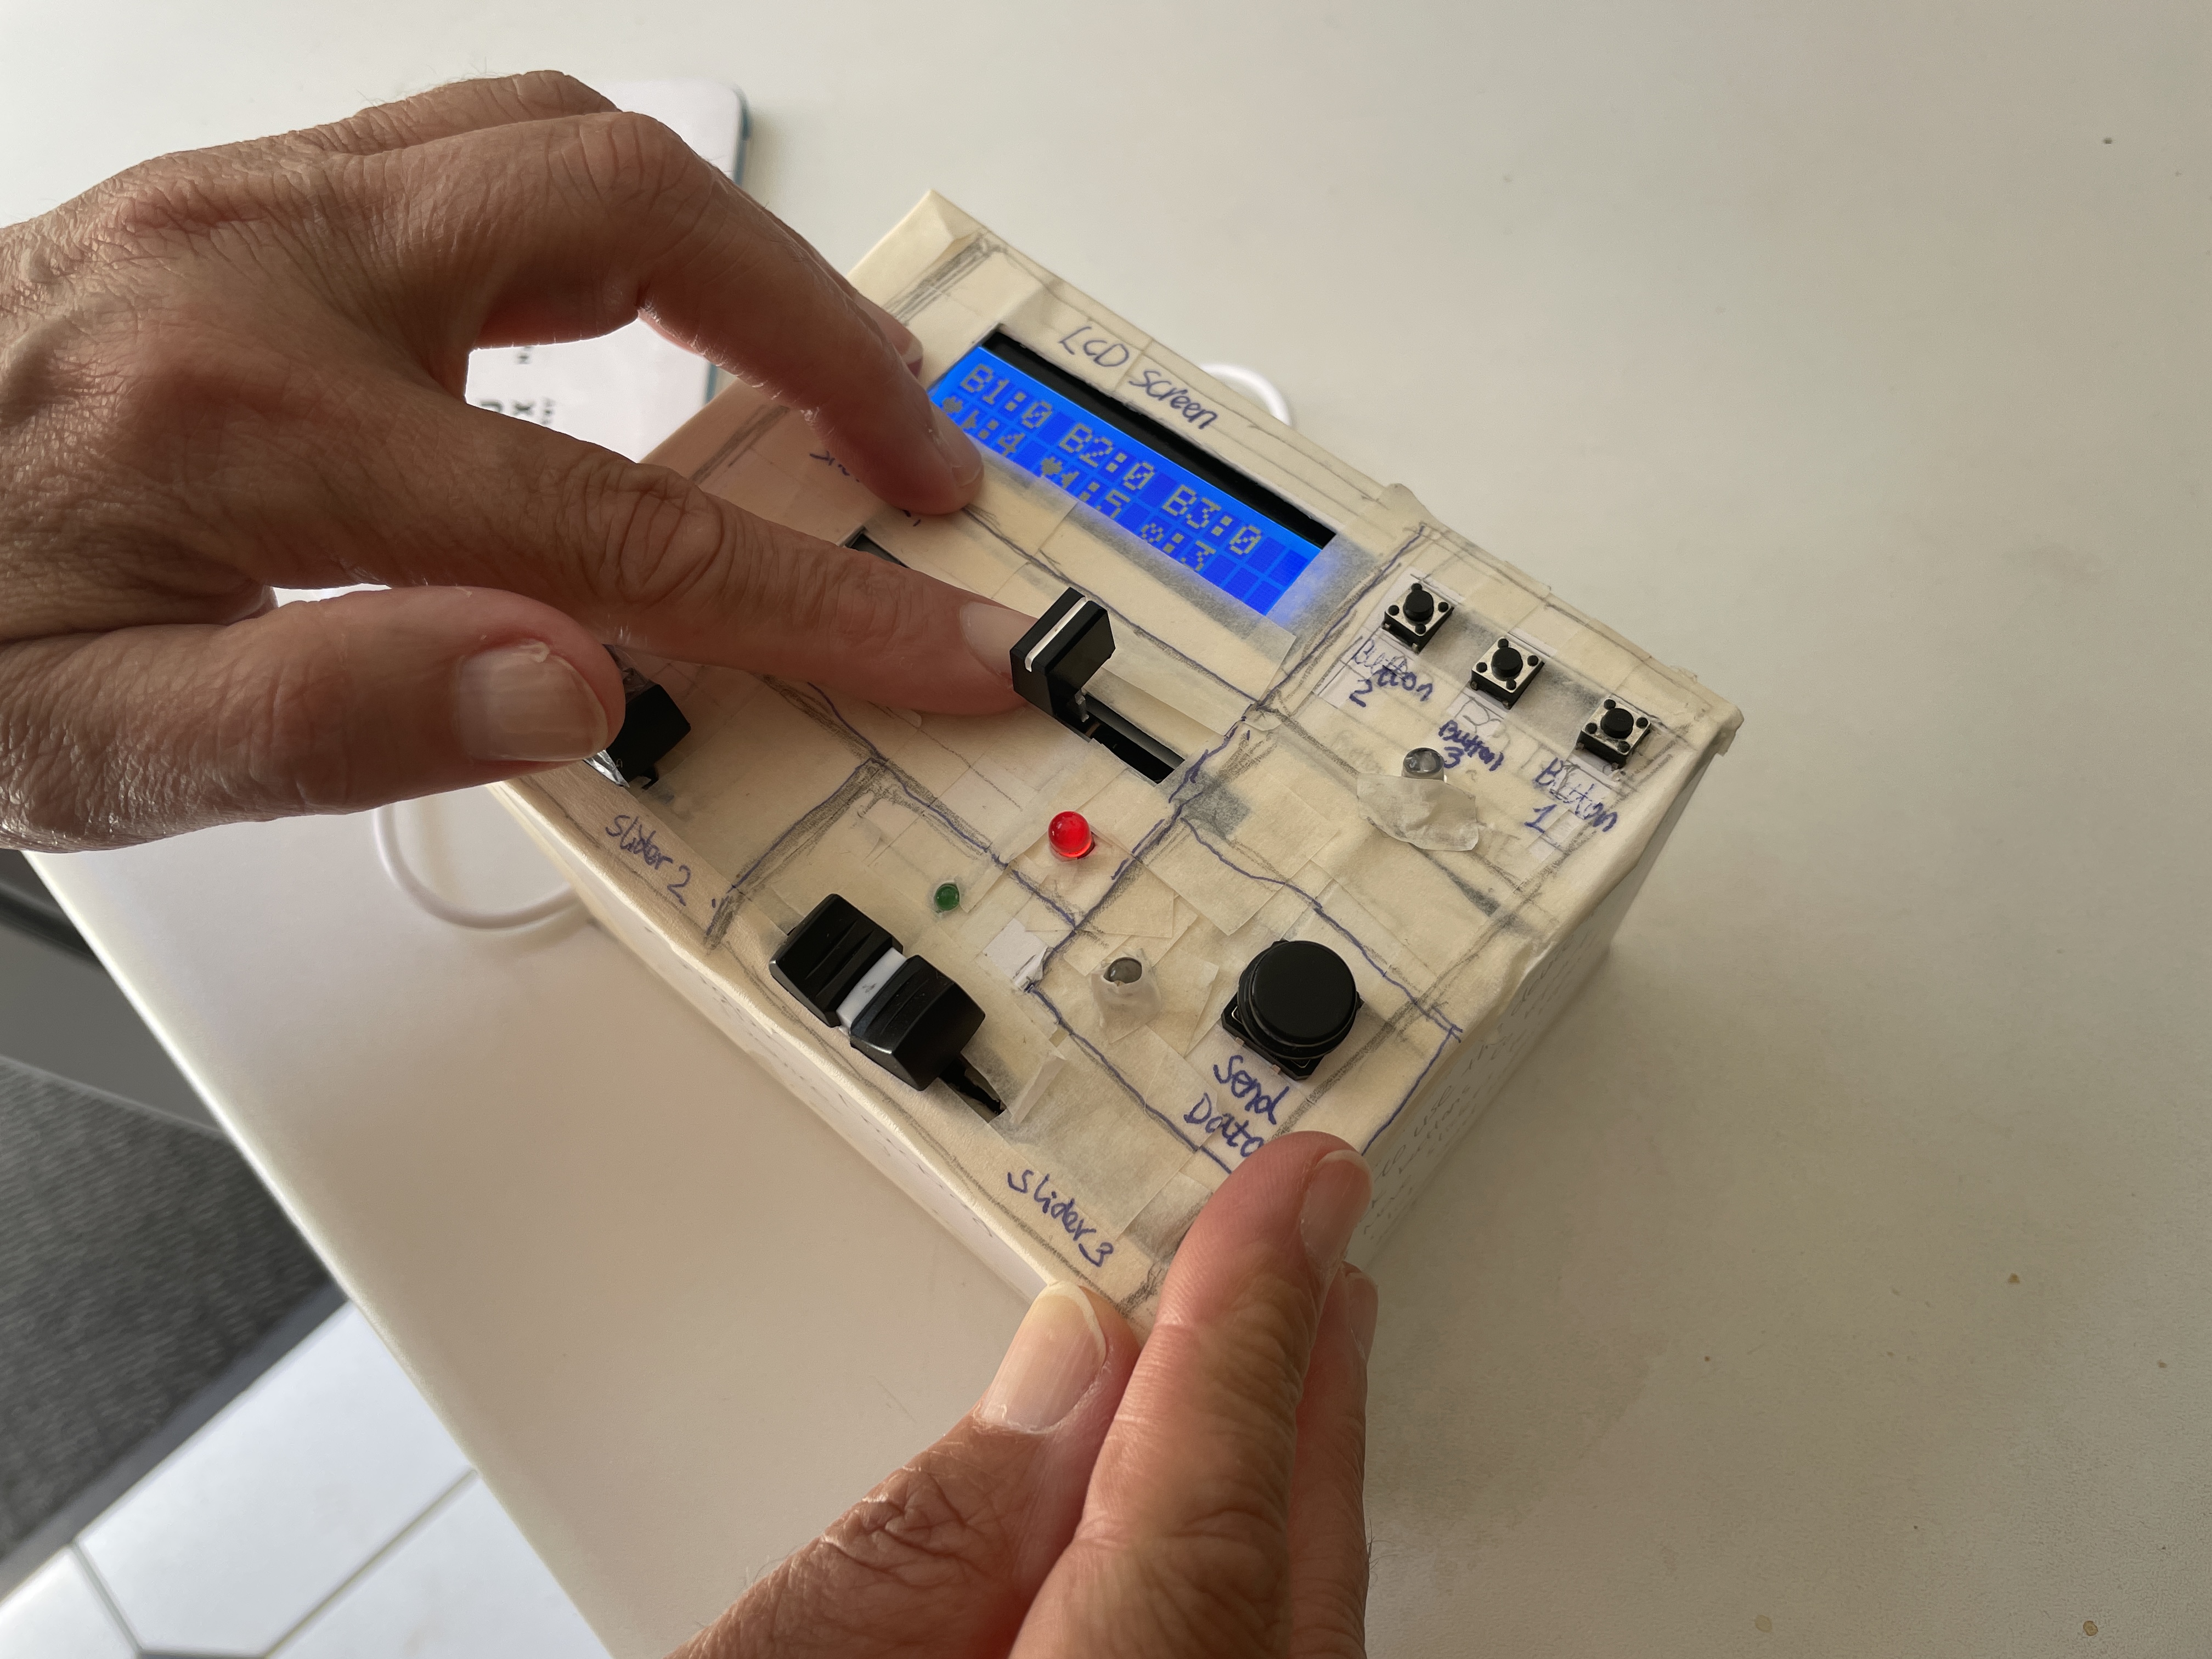
Tangible panel placed in the user's home
The collection of self reporting information from patients and family members is done through the Telegram platform chatbot (top left). Users are required to report every food and drink they intake. Through an automated script, the bot reminds the patient three times a day to reports. The bot receives data from the user and puts it into a database, from which we can estimate the amount of sugar consumed by the user and their lifestyle patterns. We also sent daily questionnaires via a Telegram chatbot asking about the support that the cohabitants felt they "gave" and the support that the patients felt they "received". Users can use the components on the tangeble panel for input.
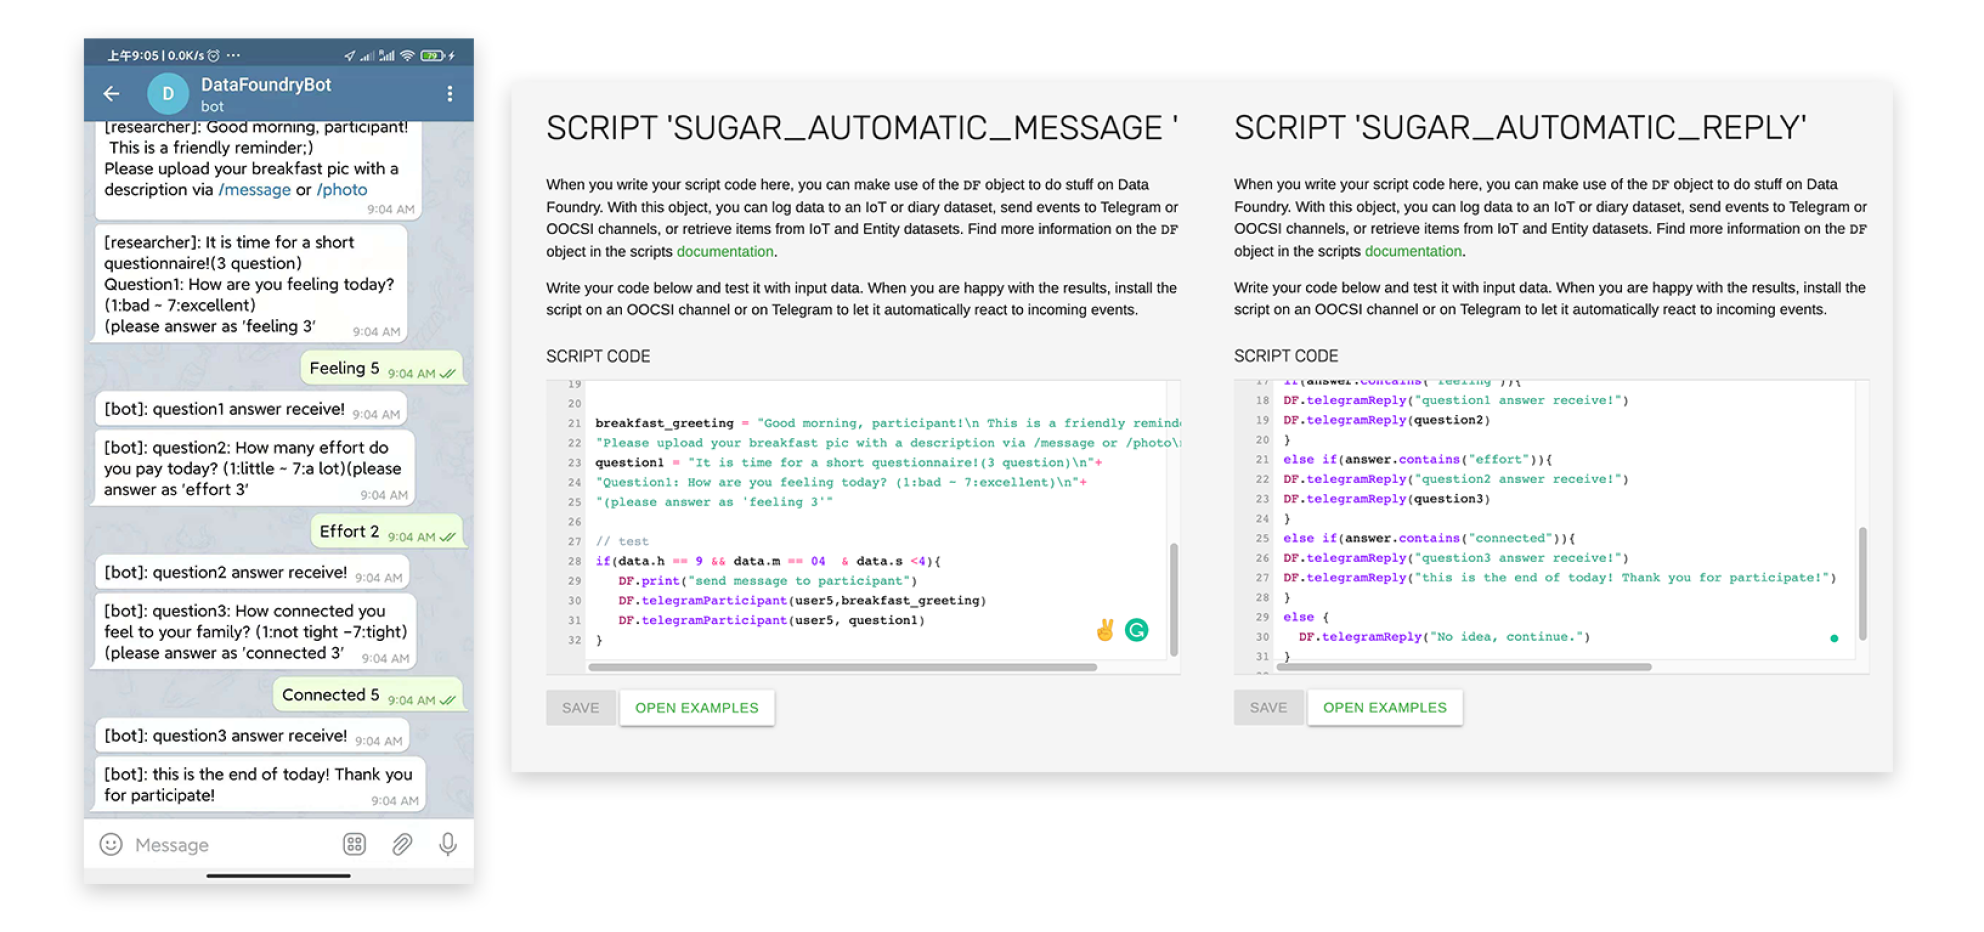
Telegram chatbot and its conversation scripts
Data Analysis
We analyzed the data collected. As shown in the figure, the couples agreed fairly consistently on the "giving" and "receiving" of their daily support, and consistently gave high scores. Therefore, we hypothesize that couples have effective communication.
The patient's wife was inspired by our data and believed that the trough in the graph of the "daily support level" was due to the fact that both partners were busy on that day and communication was reduced. Therefore, we believe that the presentation of information is actually more motivating for the patient and the patient than specific "communication coaching".
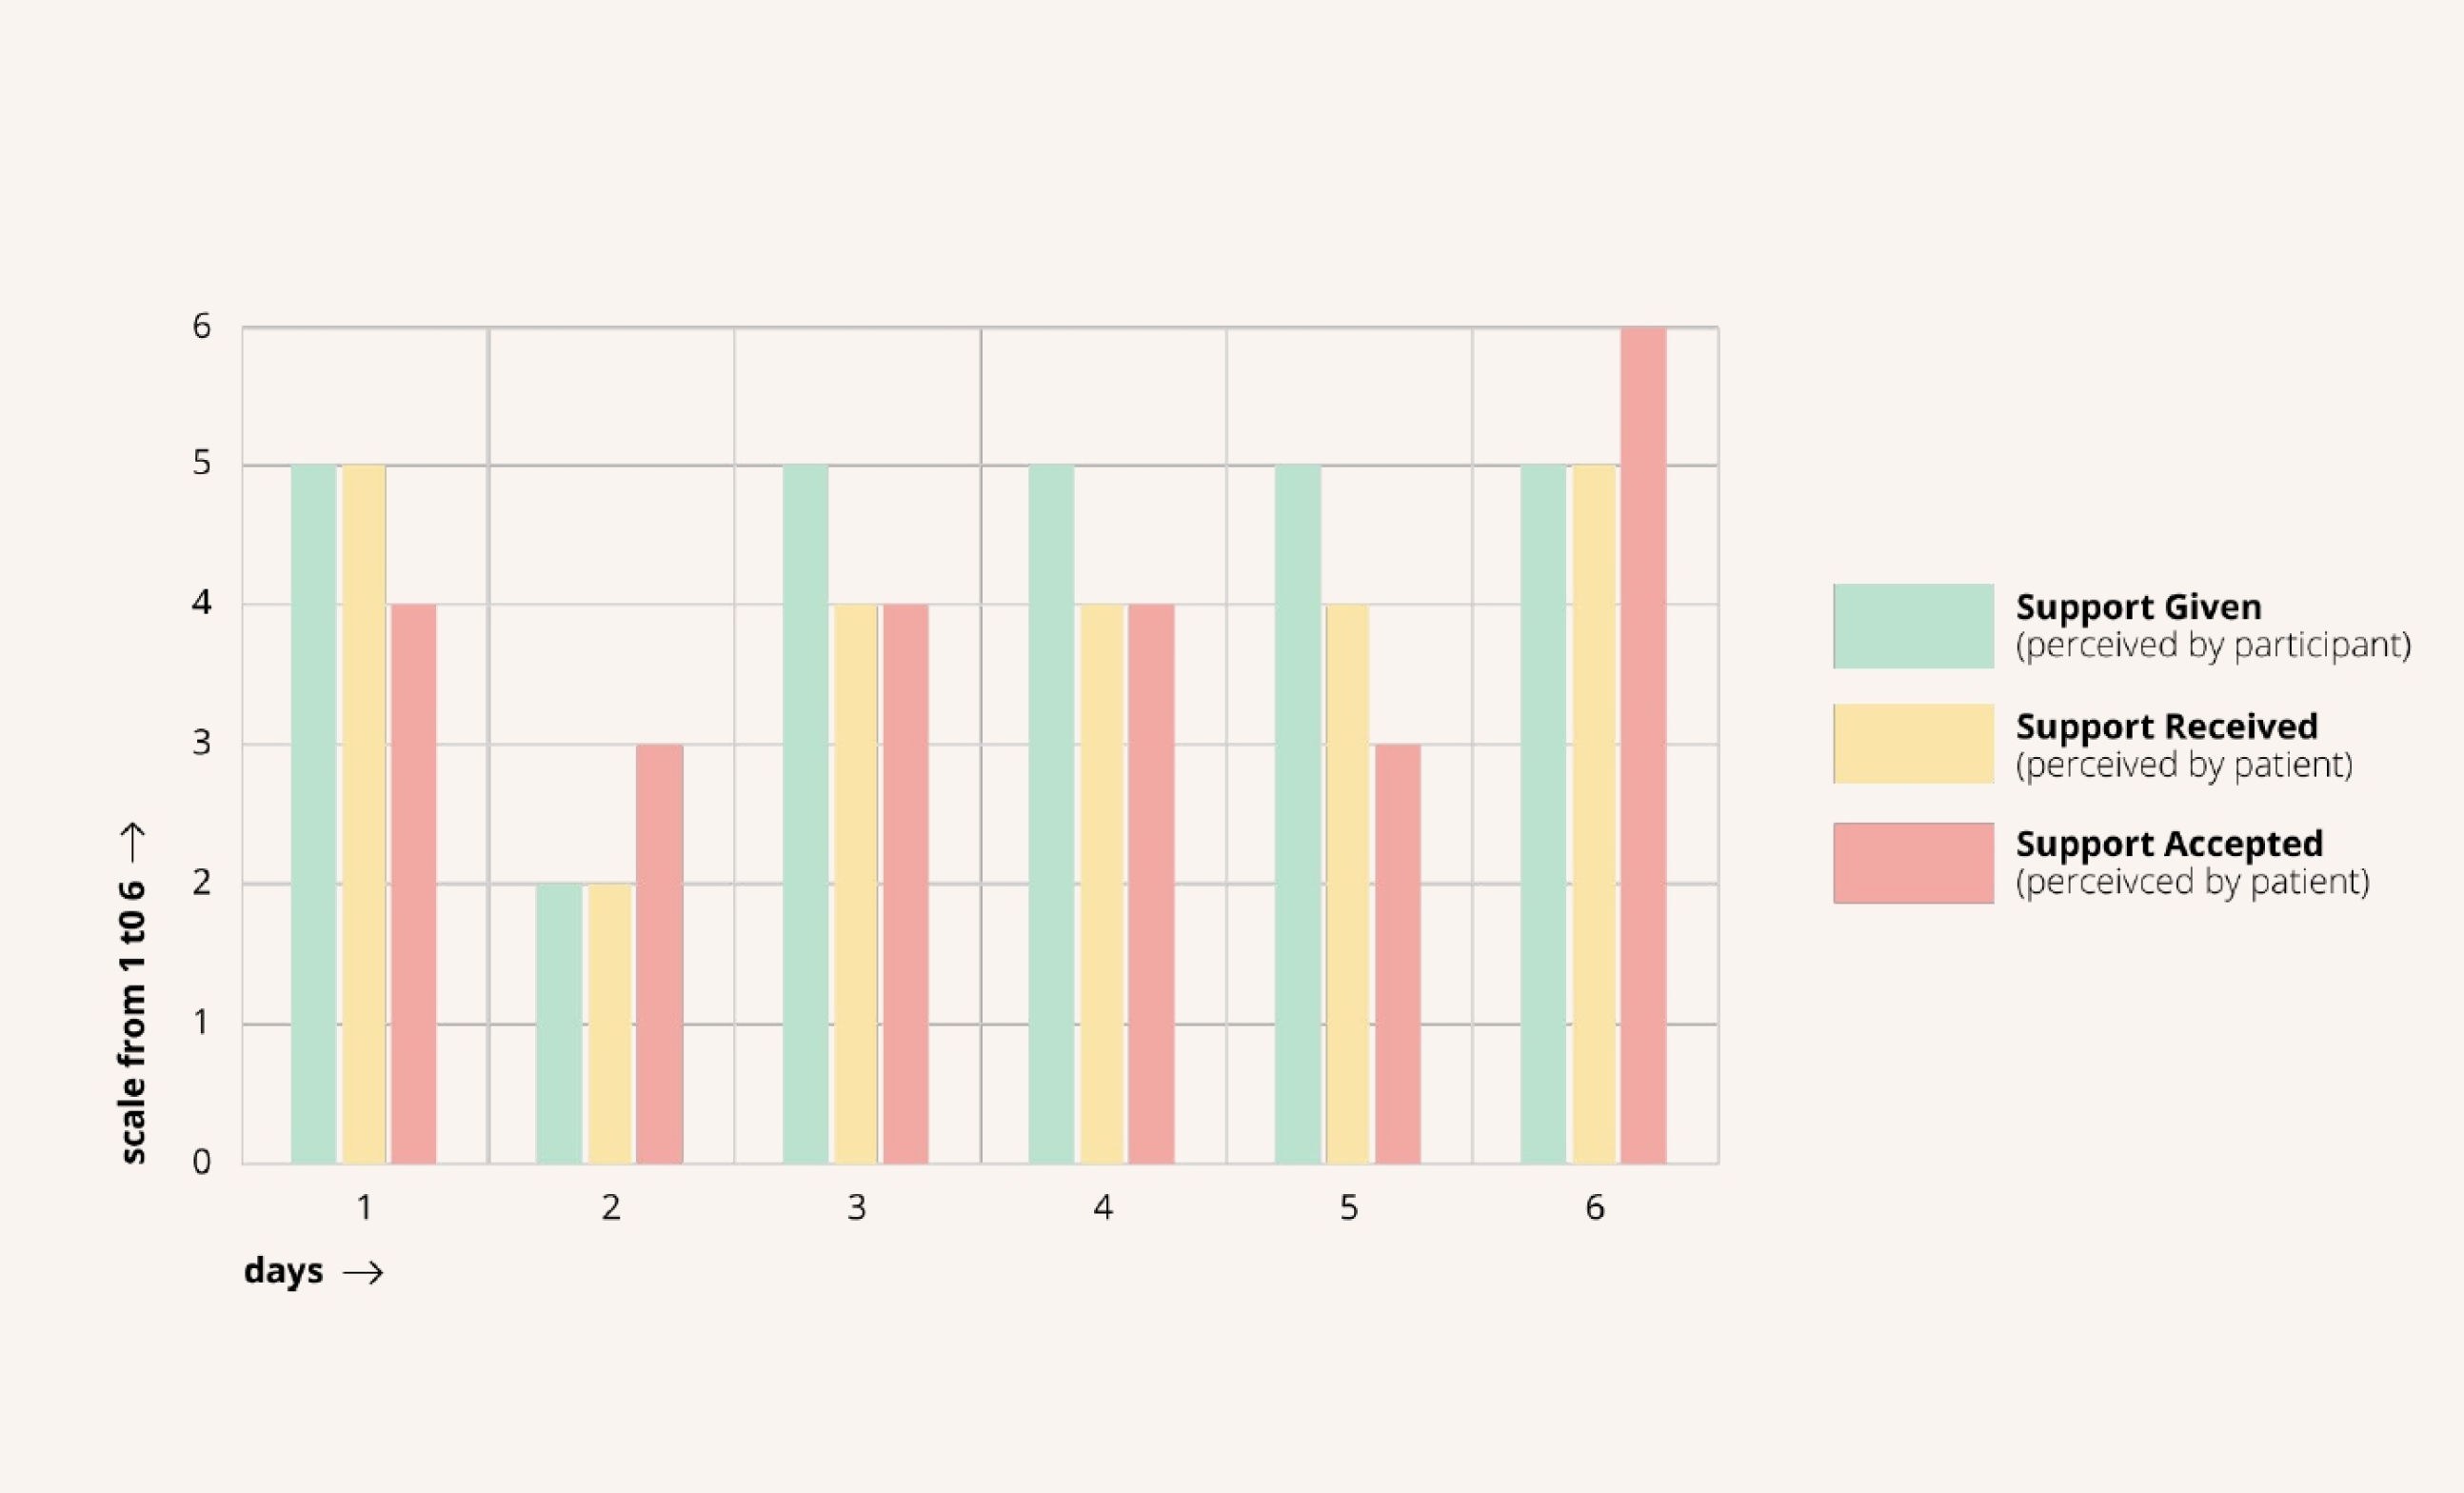
Subjective data about support
Design Interventions and Influences
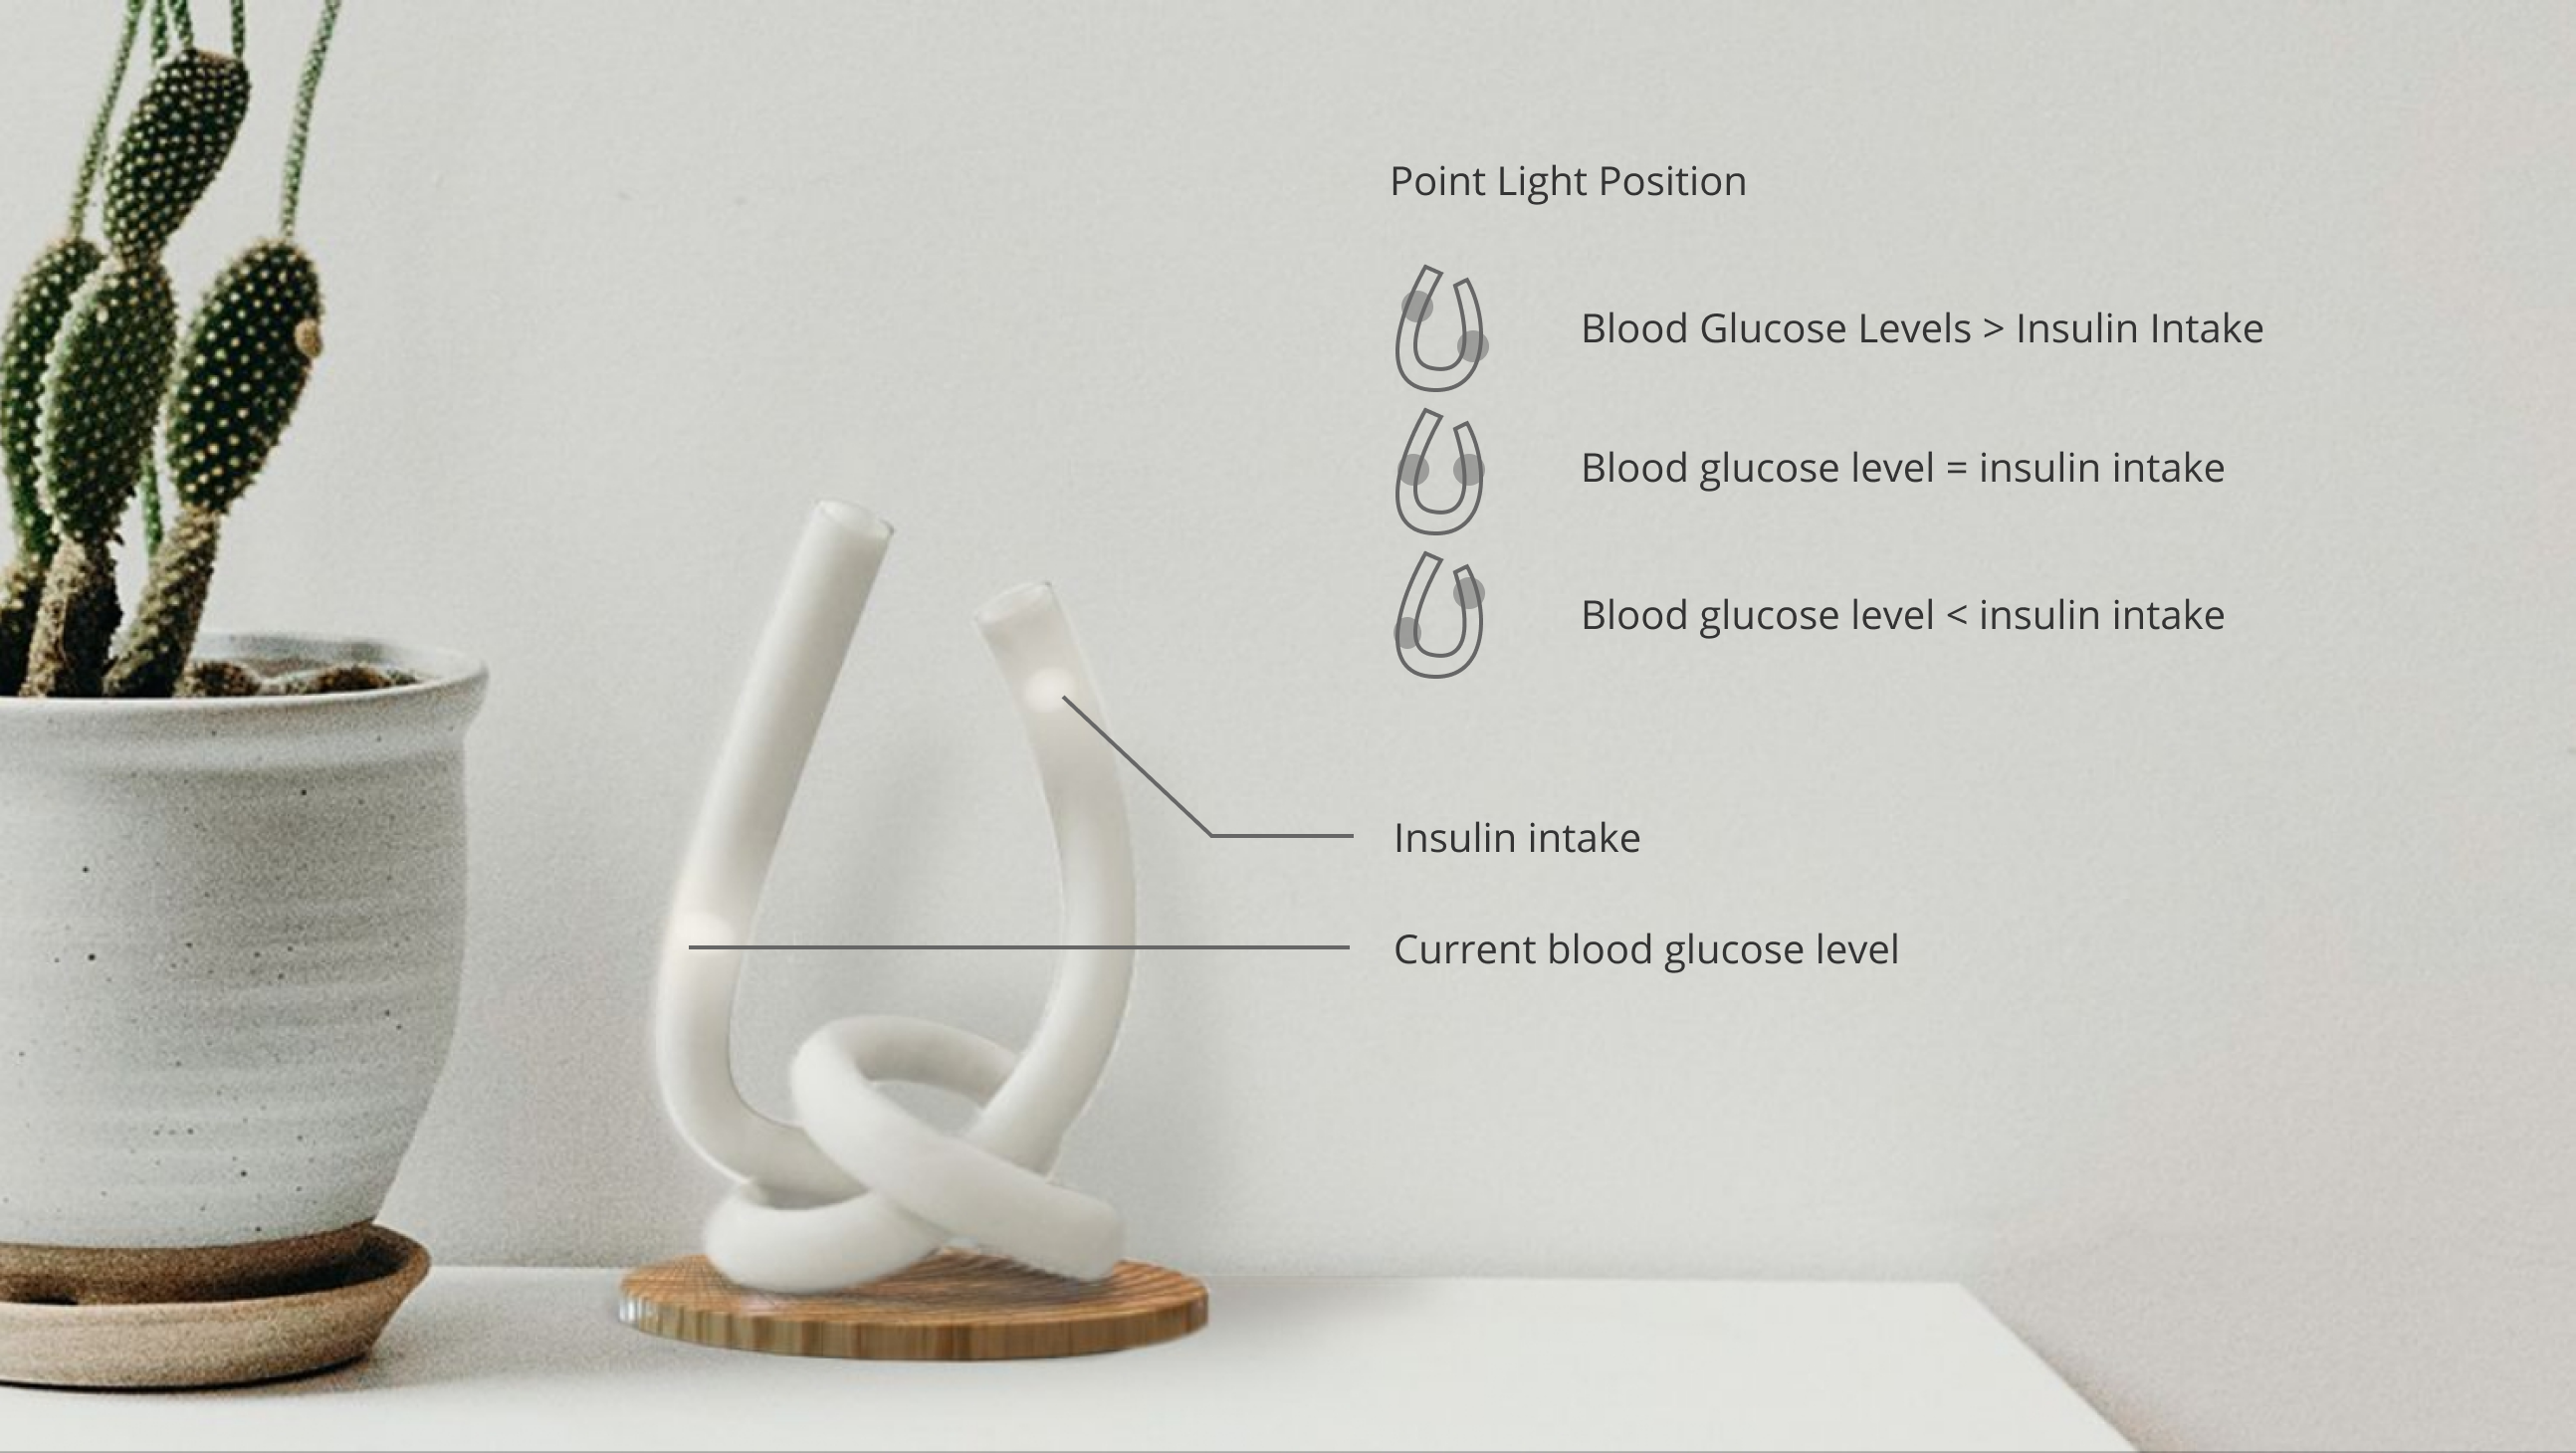
Based on our data analysis and user interviews, we designed the interactive lighting device shown in the figure. The main material is a frosted glass lamp in cream color, divided into two ends. The form of the anthropomorphic knot has the symbolic meaning of "communication connection". There is a variable height lamp bead in each of the left and right lamps, and the height of the lamp bead is changed by collecting data from the user's cell phone. The left bead represents the patient's blood glucose level; the right bead represents the patient's insulin intake.
The height of the two beads can guide the patient's insulin intake (as shown above) on the one hand, and let the family members living with the patient know the current health and medication status on the other. The patient's motivation to communicate about his physical condition has increased significantly. "He will now voluntarily share the data in the blood glucose recording app with me." The patient's family mentioned this.
Telegram chatbot and its conversation scripts